Tableau Dashboard
I created a visually appealing, informative and interactive dashboard in Tableau that showcases important insights into sales performance of an online store by using Tableau's advanced data visualization and filtering features.
Check out my GitHub profile and Tableau profile to find out more about the project.
Python
This project was created with the idea of seeing comparison of households with dogs and those with cats by state in the US. Here I used matplotlib, seaborn, plotly as best graphing packages available in Python for data visualization.
You can find it on my GitHub profile as well as on my Kaggle profile.
SQL Server EDA
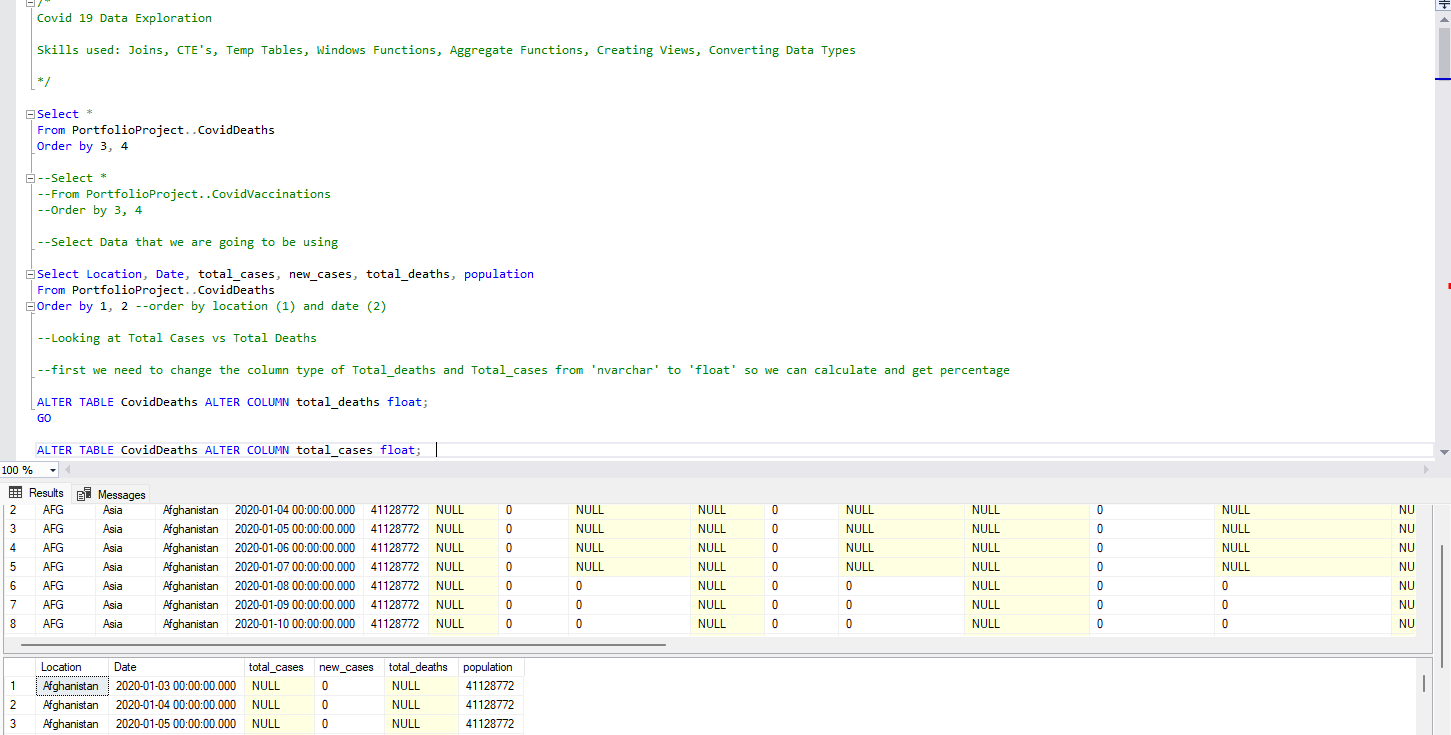
For this Project I used Microsoft SQL Server Managemant Studio to perform simple EDA on Covid Deaths and Covid Vaccinations datasets, to understand data, discover any pattern, anomalies or any findings which I will further use for my second project SQL Queries for Data Visualization in Tableau.
Here's the entire SSMS Project that can be found on my GitHub.
SQL and Tableau
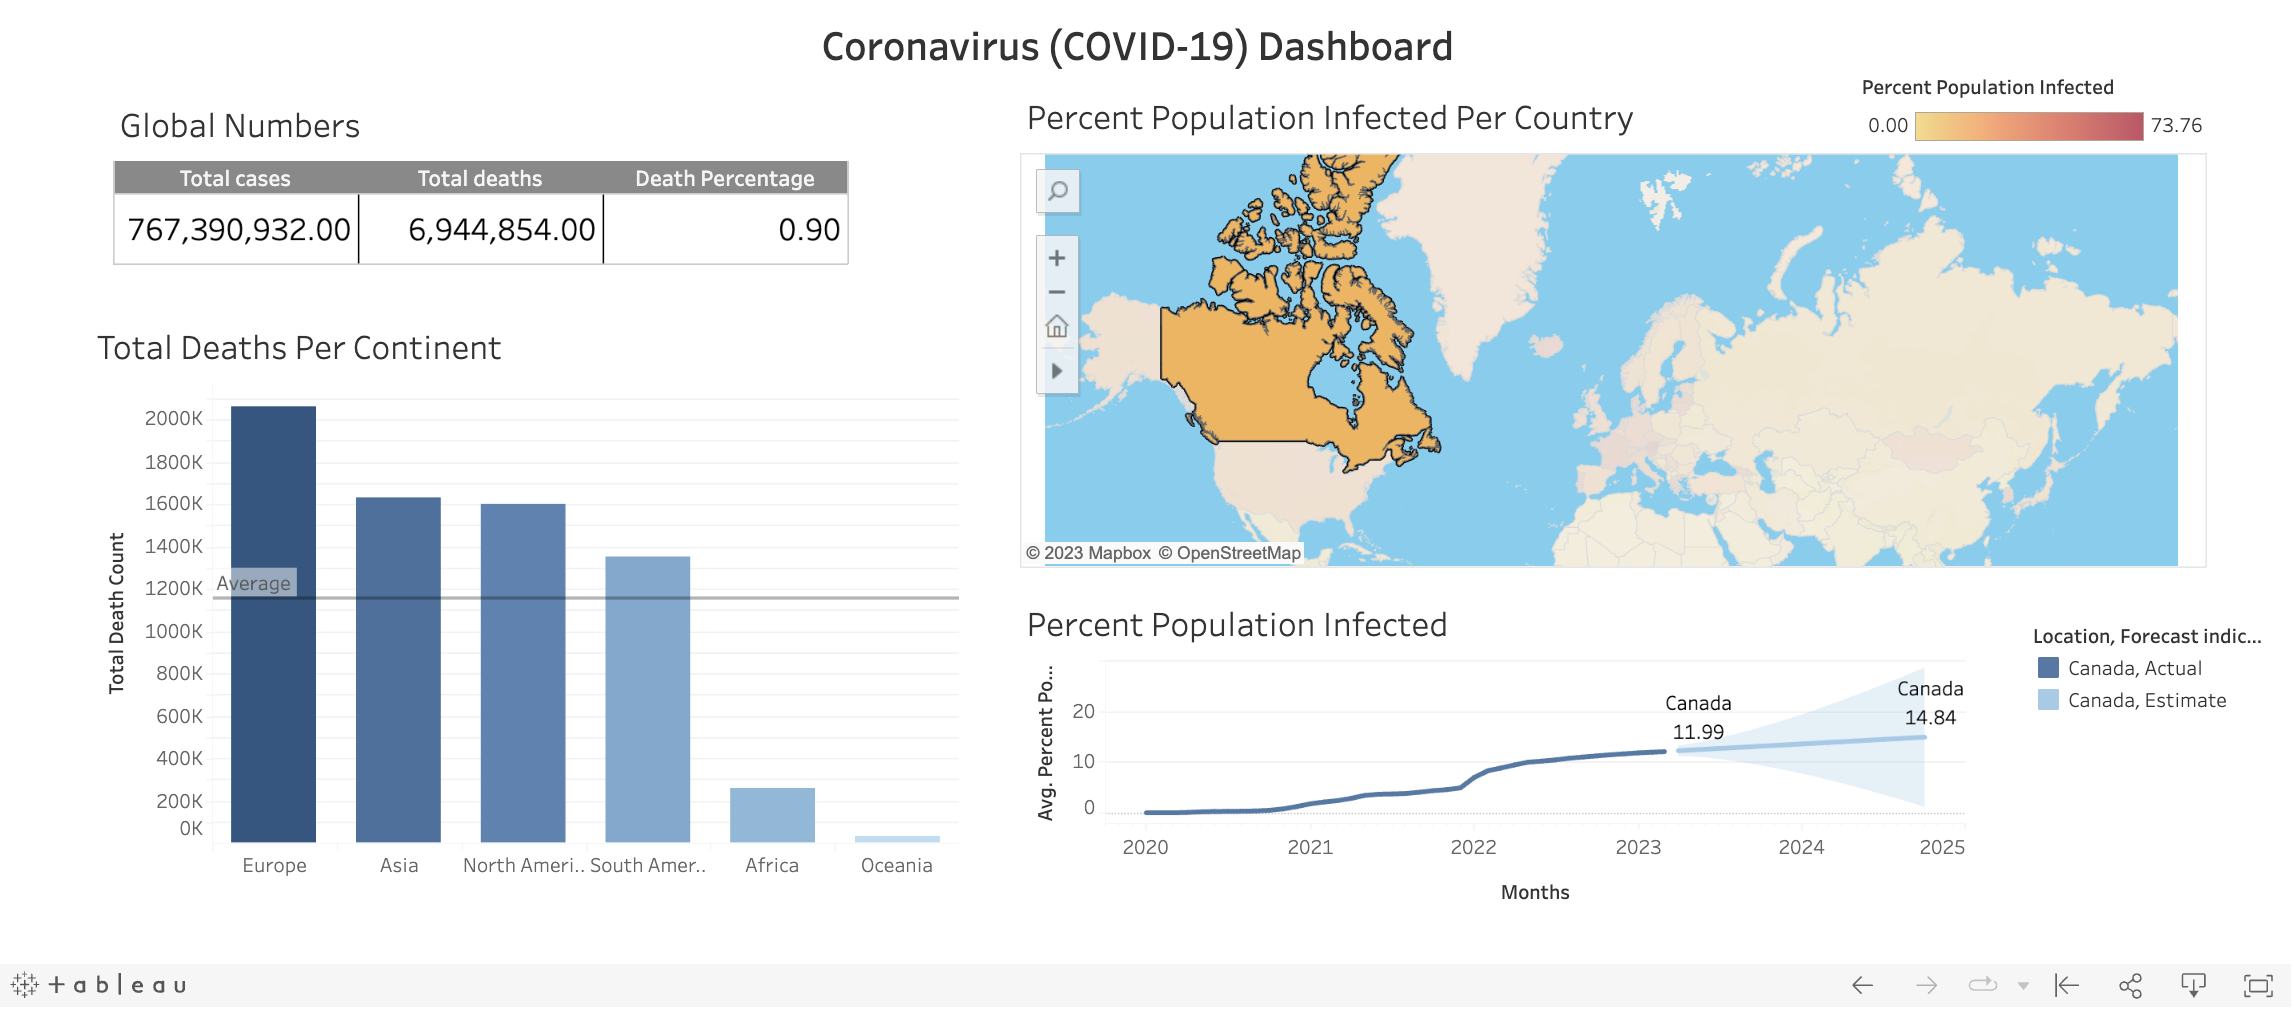
The main goal of this project is to showcase proficiency in utilizing a combination of SQL, Excel and Tableau to analyze and visualize datasets.
Check out my SQL Queries Tableau Project on GitHub and my Tableau profile.
Excel Project
This Data Analysis Excel Project aims to provide insights into sales performance of an online store over the past years by using Excel's various tools and features to transform raw data into meaningful and actionable information that stakeholders can easily understand.
The whole project explained step by step can be found on my GitHub profile.
Power BI Dashboard
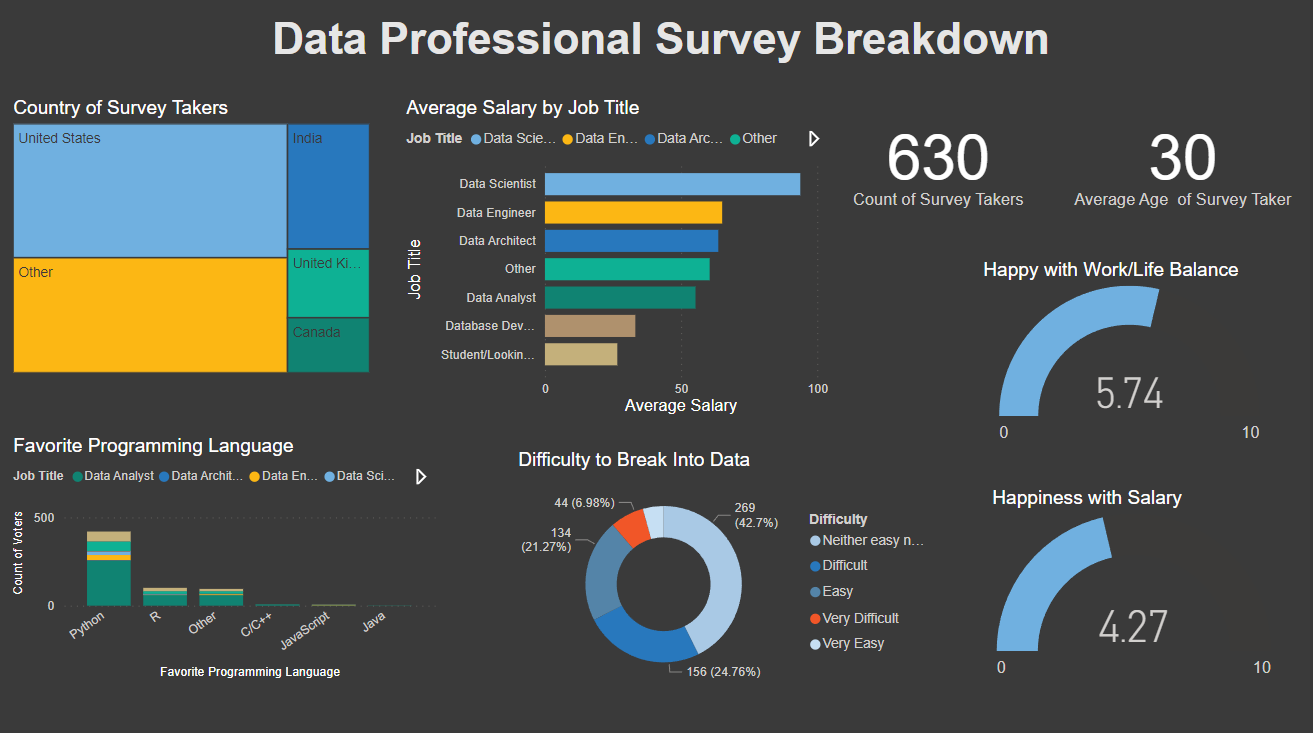
The main goal of this project is to showcase proficiency in utilizing Power BI to analyze and visualize dataset.
You can find out more about my Power BI Project on GitHub.
About me

After graduating in Tourism Management in 2010, I started working in a travel agency and then in a 4* hotel where I was in constant contact with clients. During that time, I improved my work in reservation systems, database management, sales, analysis and customer service.
In 2012 I moved to Italy after getting married and my life took a new turn.
In 2015, I opened a small shop on the Etsy marketplace dedicated to pets. That's how "PinkBau" was born, which turned into a family business and is still doing great today.
Along with running the online store, I became a mother of two kids.
Programming began to attract me more and more, which I started in 2022 to occupy my mind due to the difficult period I was going through. It turned into a passion especially when I discovered Data Analysis with Python. I started researching, reading and listening about it.
There is so much to learn, there always will be. I am going step by step to my goal of becoming an expert in analyzing and presenting data in order to make the right decisions.
Get in touch
Whether you have a question or just want to say hello, feel free to mail me about any relevant project and job updates.
Elements
Text
This is bold and this is strong. This is italic and this is emphasized.
This is superscript text and this is subscript text.
This is underlined and this is code: for (;;) { ... }. Finally, this is a link.
Heading Level 2
Heading Level 3
Heading Level 4
Heading Level 5
Heading Level 6
Blockquote
Fringilla nisl. Donec accumsan interdum nisi, quis tincidunt felis sagittis eget tempus euismod. Vestibulum ante ipsum primis in faucibus vestibulum. Blandit adipiscing eu felis iaculis volutpat ac adipiscing accumsan faucibus. Vestibulum ante ipsum primis in faucibus lorem ipsum dolor sit amet nullam adipiscing eu felis.
Preformatted
i = 0;

while (!deck.isInOrder()) {
    print 'Iteration ' + i;
    deck.shuffle();
    i++;
}

print 'It took ' + i + ' iterations to sort the deck.';
Lists
Unordered
- Dolor pulvinar etiam.
- Sagittis adipiscing.
- Felis enim feugiat.
Alternate
- Dolor pulvinar etiam.
- Sagittis adipiscing.
- Felis enim feugiat.
Ordered
- Dolor pulvinar etiam.
- Etiam vel felis viverra.
- Felis enim feugiat.
- Dolor pulvinar etiam.
- Etiam vel felis lorem.
- Felis enim et feugiat.
Icons
Actions
Table
Default
| Name |
Description |
Price |
| Item One |
Ante turpis integer aliquet porttitor. |
29.99 |
| Item Two |
Vis ac commodo adipiscing arcu aliquet. |
19.99 |
| Item Three |
Morbi faucibus arcu accumsan lorem. |
29.99 |
| Item Four |
Vitae integer tempus condimentum. |
19.99 |
| Item Five |
Ante turpis integer aliquet porttitor. |
29.99 |
|
100.00 |
Alternate
| Name |
Description |
Price |
| Item One |
Ante turpis integer aliquet porttitor. |
29.99 |
| Item Two |
Vis ac commodo adipiscing arcu aliquet. |
19.99 |
| Item Three |
Morbi faucibus arcu accumsan lorem. |
29.99 |
| Item Four |
Vitae integer tempus condimentum. |
19.99 |
| Item Five |
Ante turpis integer aliquet porttitor. |
29.99 |
|
100.00 |
